Friday, February 29, 2008

Friday, Feb 29


These multi-flow maps were used in an Advaned Algebra class to help connect the relationships between matrices and transformations. The students were given the blank maps and filled them in as the unit progressed. This is an example of Thinking Maps being used as graphic organizers. The students reported they found it very helpful.


Thursday, February 14, 2008

Thurs, Feb 13


This tree map was included in a geometry unit designed to help students differentiate the notation and vocabulary of basic geometric structures. It was a topic the teacher felt the students had struggled with in the past that prevented them from doing more complex geometry. Before creating the tree map the students had created circle maps for each of the basic words (see the posting on Thur, Jan 24), and they defined them using NUA's defining format. Immediately before creating this tree map, the students did a List Group Label activity. Groups of 4 were given index cards with each of the phrases you see on the tree map mixed together in no particular order. They sorted the cards based on their own categories and then made the tree map based on their categories.

Wednesday, February 13, 2008

Thurs, Feb 7


These flow maps were used as a review activity before the final assessment on techniques of integration. The day before the flow map assignment, the students worked in teams to solve as many integrals correctly as they could. When the final number of correct integrals were counted, however, an incorrect answer reset their total count to zero. Thus, they were encourgaed to be accurate as well as quick. As a follow up, I prompted students to think about how they started the process of evaluating an integral. Many students said they just think and wait for inspiration. The point of the flow map, of course, is that it encourages the students to think specifically about the process they used. Each group shared the flow maps, and it wasn't until all groups had shared that we actually had a complete flow map that did not omit any techniques. In other words, all of the flow maps were somewhat incomplete and it took the whole class to create a complete flow map.


Wed, Feb 6


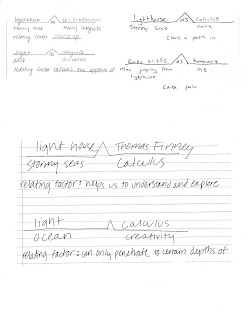
At the beginning of the second semester I asked my calculus students to create a brigde map using the cover of their textbook as a reference. Bridge maps are used for analogies. I prompted them by asking them to think about why the publisher of the book chose the lighthouse and stormy sea picture for the book. I asked each student to create two bridge maps. For one of them, I gave them 2 parts: 1) lighthouse, 2) stormy sea. They had to come up with two analogous parts and the relating factor. For the second bridge map I asked them to come up with all of the parts, but it had be in the context of the book cover. The first student example to the right of the book cover above is read: A lighthouse illuminates stormy seas as calculus illuminates an otherwise challenging problem. The students enjoyed the challenge and it was a good way to discuss in very general terms what the purpose of calculus is. Some students were very poetic. Light only penetrates to certain depths of the ocean as calculus only penetrates to certain depths of creativity. However, I was hoping some students would express the purpose of calculus specifically as a way of thinking that involves lots of changing variables. Instead, most all of the bridge maps were about the utility of calculus for solving problems. The bridge map helped me learn that they view calculus as a problem solving tool but not really as a way of thinking that is worthwhile as a stand alone activity.


Thursday, January 24, 2008

Thur, Jan 24


Teacher S and I are working on using NUA strategies to help students compare and contrast the definitions and notations for lines, rays, line segments, angles, and triangles. The problem seems to be one of literacy, so we are approaching the lessons with an emphasis on vocabulary development using circle maps, defining format, a list-group-label activity, tree maps, and some activities involving movement. Perhaps we will use a double-bubble as well.


The first activity was to ask students to create 4 different circle maps - one for each of the words line, line segment, ray, and angle. The were asked to write down words or pictures or symbols related to the given word. After about 8 minutes, students were asked to stand up and walk to the poster paper hanging at the front of the room and write down one of their words on the corresponding circle map. The circle maps for ray and line segment are shown in the pictures. We forgot to write the given word in the circle in the center, and we did not discuss the frame. We should have. These were mistakes simply because we are beginners at this! A good question for the frame could have been “What words or symbols come to mind when you see the word ray?”


As in the volume circle maps, there are many associations with the word ray that are not a part of the formal geometric definition of ray. However, having a time and place to write those associations and see them seems to be helpful because it acknowledges that the students have previous experience with the word ray. It is not until day 2 that we will formally define ray using the defining format.


After discussing various words and symbols and the circle maps we moved to a 10 minute post-it note activity. Five diagrams were already drawn on the whiteboard that consisted of a large variety of lines, line segments, rays, angles, and triangles. Each student was given 5 post-it notes. Their work was to find an example of a line segment somewhere in one of the diagrams and to write the formal notation for it on the first post it note. They did the same for line, ray, etc. Next, the students walked to the whiteboard and stuck their post-it notes directly on the segments, rays, etc, they described. This was a great assessment tool for the teacher! Teacher S could quickly see whether or not the class could correctly identify and label the 5 geometric literacy terms of the lesson. He could also see common errors and share them with the class. Everybody participated and yet nobody was singled out by not having complete comprehension. See the corresponding picture.

Wednesday, December 19, 2007

Wed, Dec 19 #6


Here is a teacher generated Tree Map about graphing rational functions. I used it to summarize three days of activities, discussions and examples about the complexities of rational functions. The students were asking lots of questions about particular procedures and parts of the examples, but I didn't think they had a strong grasp of the whole picture. Using the Tree Map was very helpful because it made obvious the differences between local and global behavior. It also helped to categorize all of the procedures and definitions and examples we had discussed.

Wed, Dec 19 #5


Here is a student generated Flow Map for graphing a rational function. We had just spent 3 days learning about essential and removeable discontinuities, vertical, horizontal and oblique asymptotes, local and global behavior, etc. The student came for extra help so I did one more example, and then I asked her to create a Flow Map in preparation for the exam. It seemed to work well for her. I know it was on her mind during the exam because when I asked a "stretch" question she let me know that it wasn't on her Flow Map!